[NDH 2016] [Forensics 150 – Draw Me a Sheep] Write Up
Description
It is starting to become a usual kind of challenge.
we are given a pcap file with the registered usb traffic of an unknown device which should lead to the drawing of a Flag.
draw me a ship
Question: Draw me a Flag
Resolution
for this kind of challenge, we usually start opening the pcap file with wireshark.
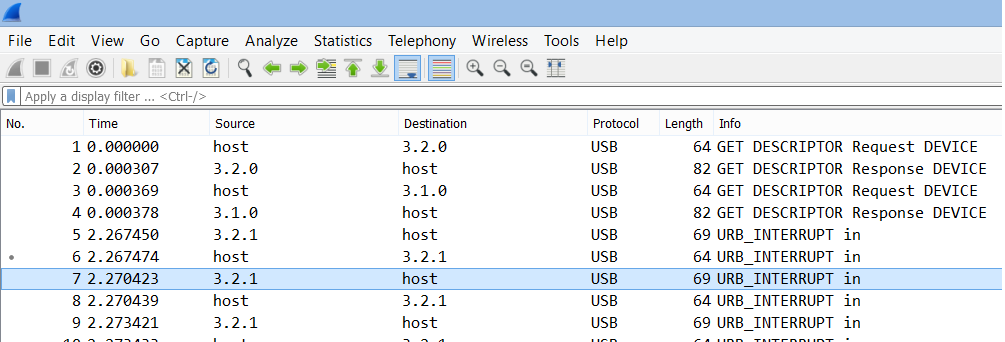
we can quicly validate that it is a usb traffic. it’s traffic between the host and the device connected to the usb controller 3, with adress 2. (well, i guess that’s what it means)
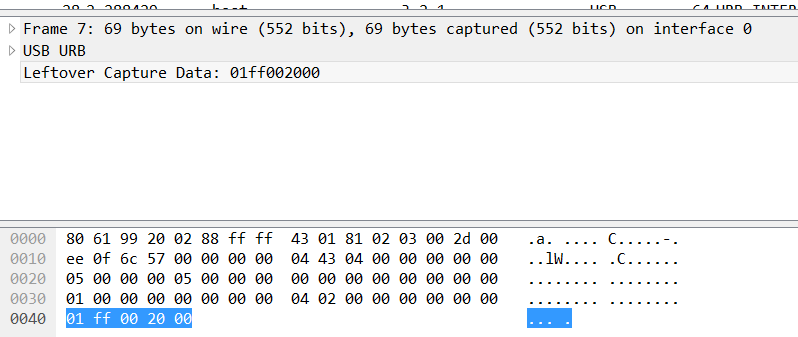
we can see that the datas are freely available. no encryption with usb mouse datas (yet ?) :
we then need to get thoses datas :
at that point you have 2 options :
- either you send it to india/china and you pay in bitcoin to get the data extracted manually line by line
- or you automate this with tshark :
tshark -r file -Y 'usb.capdata and usb.device_address==3' -T fields -e usb.capdata > raw
as we already used all our money on alcool, that’s the path we chose.
you now have a nicely ordered list of inputs, with each line looking like :
01:ff:00:20:00

01:00:00:21:00

00:01:00:21:00
with a quick look, you get that relevant datas are in colum 0,1 and 3
on the first look you can gess that column 0/1 are relevant to the way the mouse moves, and column 3 must be the state of a button (either it’s clicked or not clicked)
but if you really want to do things right you can check some stats about it :
def stats_my_raws(rawfile):
	# get the datas
	f = open(rawfile)
	filedatas = f.read()
	f.close()
	raw_datas = filedatas.split('\n')

	for column in range(5):
		stats = {}
		for index, line in enumerate(raw_datas[:-1]):
			line=line.split(':')
			if line[column] in stats:
				stats[line[column]] += 1
			else:
				stats[line[column]] = 1
		#Print result
		print "Column %i stats :"%column
		for i in sorted(stats, key=stats.__getitem__, reverse=True):
			print "%s : %.02f %% - [%i]" % (i, 100.0 * stats[i] / len(raw_datas), stats[i])

#output :
'''
Column 0 stats :
00 : 48.19 % - [2495]
ff : 31.52 % - [1632]
01 : 17.98 % - [931]
02 : 1.85 % - [96]
03 : 0.42 % - [22]

Column 1 stats :
00 : 46.30 % - [2397]
ff : 27.64 % - [1431]
01 : 24.45 % - [1266]
fe : 1.58 % - [82]

Column 3 stats :
21 : 54.36 % - [2814]
20 : 45.62 % - [2362]
'''
So, we know that column 3 is a button and only has 2 possible value. so one of them must be “pressed” and the other one … i’ll let you guess
collumn 0 and 1 seams to behave in the same way, it’s either 00,01,02 or -01, -02 (FF/FE would be -01/-02 on a 2 byte signed integer)
Now that we are sure, let’s go to the fun part .
The idea is to :
- Create an image file. B/W setting it to full black.
- follow the mouse movments
- Draw each point of the mouse when the button is “clicked”
we just don’t know how big is the user screen and where it start from. so let’s create a pretty big picture and start at the center
def resolv(filepath):
	#get the datas
	f=open(filepath)
	filedatas=f.read()
	f.close()
	raw_datas=filedatas.split('\n')

	#Create a Black/White image
	size=2000
	img = Image.new("L", (size,size), 0) #Yep, a big one just to be sure
	draw = ImageDraw.Draw(img)
	pos=[size/2,size/2] #We start at the center of it

	#Just to know the max size we really need
	min_pos=[size/2,size/2]
	max_pos=[size/2,size/2]
then we go threw every moves and eventually print it :
for index,line in enumerate(raw_datas[:-1]):#last value is '\n'. we don't need that
   datas=line.split(':')

   if len(datas)==5:#just to filter bad input
      mouse_click=int(datas[3],16)#Fourth row is our "right click button"
      #Get the movments. it's signed 2bytes integer, so minus 0x100 if over 0x7f
      x_movement=int(datas[0],16)
      if x_movement>0x7f : x_movement-=0x100
      y_movement=int(datas[1],16)
      if y_movement > 0x7f: y_movement -= 0x100
      #
      pos[0]-=x_movement
      pos[1]+=y_movement
      #registering min/max value
      if pos[0] > max_pos[0]:max_pos[0]=pos[0]
      if pos[1] > max_pos[1]: max_pos[1] = pos[1]
      if pos[0] < min_pos[0]: min_pos[0] = pos[0]
      if pos[1] < min_pos[1]: min_pos[1] = pos[1]
      print "%s - %i:%i - %i:%i"%(line,x_movement,y_movement,pos[0],pos[1])

      if mouse_click  == 0x21:#if button is held down, we are writing
         do_point(pos,draw,5)
   else :
      print "error on line :%i - %s"%(index,line)
#img.show()
img.save('im2.png')
print "Min max positions : ",min_pos,max_pos
printing would be done by adding a point in our image
def do_point(pos,draw,size=2):#Print a point in the picture
   for x in range(size):
      for y in range(size):
         draw.point([pos[0]+x,pos[1]+y], fill=255)
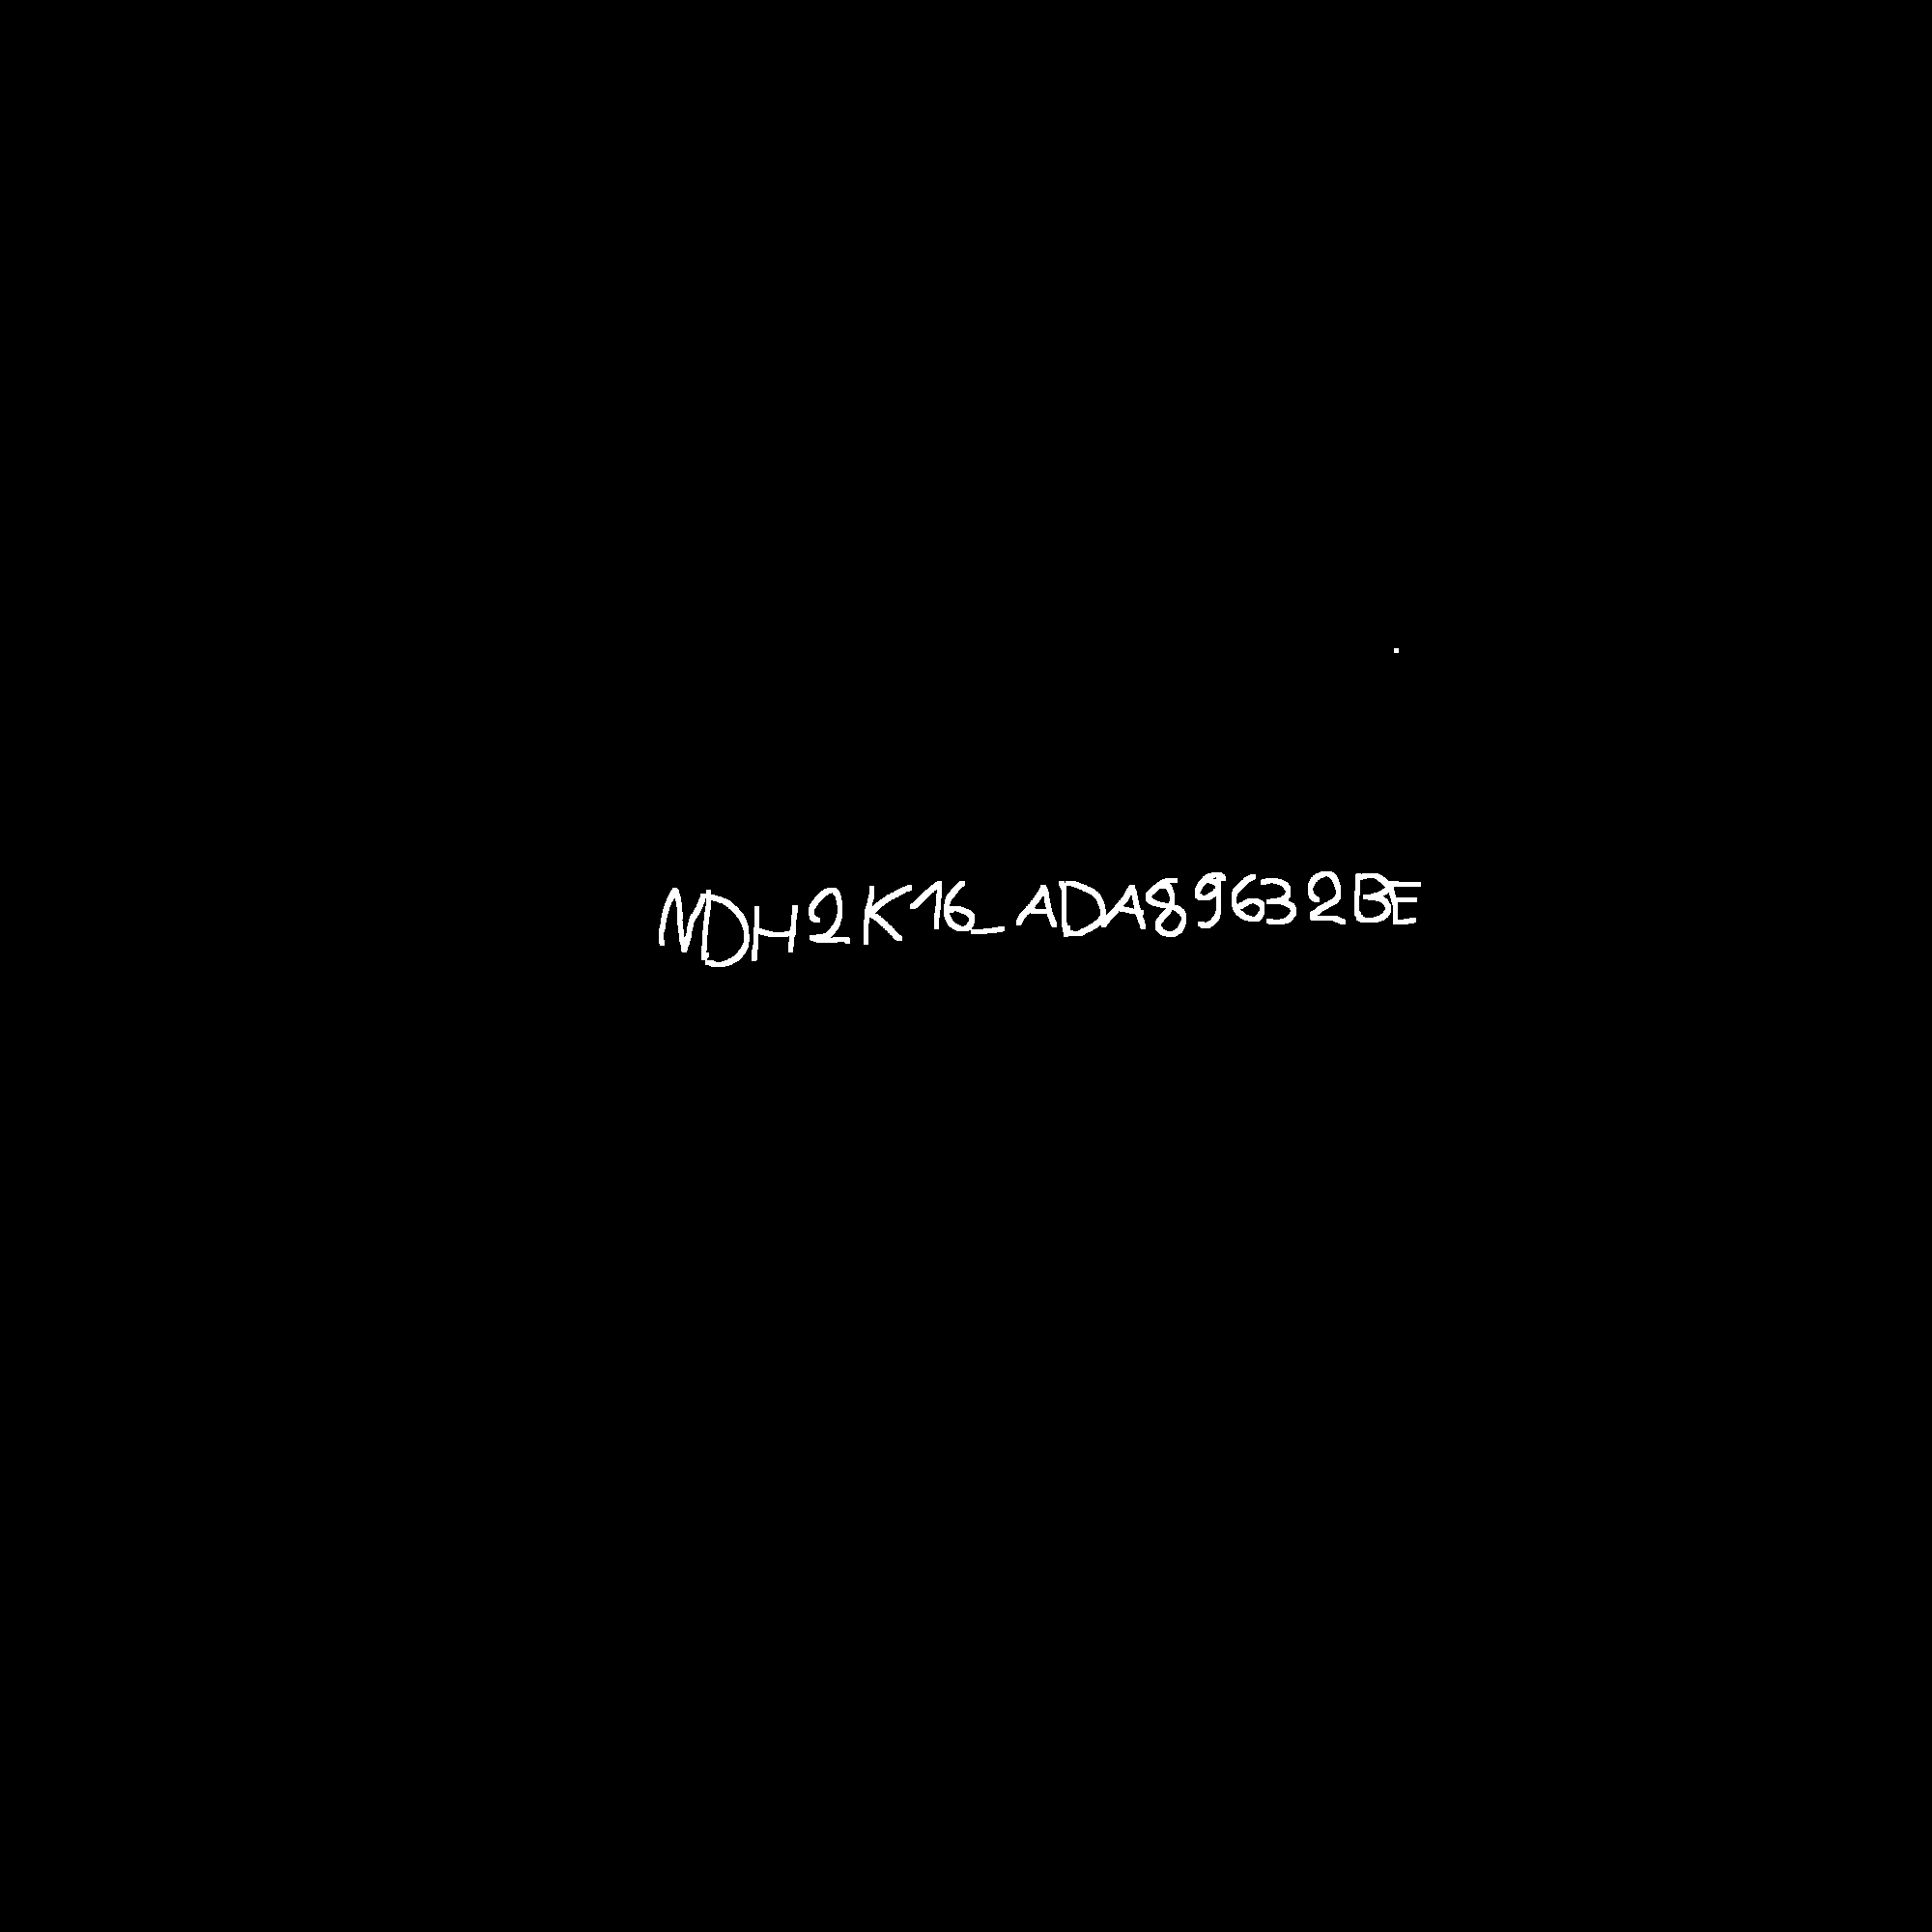
and … Voila :